Interaction to Next Paint (INP): The Complete 2026 Guide to Google’s Responsiveness Metric
Interaction to Next Paint (INP) is a Core Web Vitals metric that measures how quickly a webpage visually responds to a user’s click, tap, or key press. Google uses INP as an official ranking signal, and a page passes only if 75% of visits score 200 milliseconds or less (measured at the 75th percentile, or “p75,” of real-user data from the Chrome UX Report). INP replaced First Input Delay (FID) as a Core Web Vital on March 12, 2024, because FID only captured a page’s first interaction. INP tracks every click and tap across the entire visit and reports the worst one. As of 2026, roughly 36% of desktop sites and 45% of mobile sites still fail to reach the “Good” INP threshold, which makes INP the single hardest Core Web Vital for most teams to pass.
Below, we break down exactly how INP is measured, why it replaced FID, what the real-world data shows, how the leading measurement and optimization tools compare, and the concrete steps that move the needle fastest.
Why INP Exists: The FID Blind Spot
For years, Google measured page responsiveness using First Input Delay, which only clocked the delay before a browser could begin processing a user’s very first interaction on a page. That created an obvious blind spot: an e-commerce product page could register a lightning-fast FID on the first click, then feel completely frozen the moment a shopper tried to add an item to their cart, filter results, or open a size selector, because heavy JavaScript running later in the session choked the main thread. Sites were passing a “responsiveness” metric while genuinely unresponsive in practice.
INP closes that gap. It samples the input delay, processing time, and rendering delay of every interaction during a page visit and surfaces the single slowest one (technically, a high percentile of interactions on pages with many events) as the reported score. For JavaScript-heavy applications, single-page apps, dashboards, filterable e-commerce catalogs, and checkout flows. This is a meaningfully stricter bar, and it’s why many sites that comfortably passed FID are now discovering INP problems they never knew existed.
Chrome DevTools’ Performance panel is the standard tool for diagnosing why a specific interaction is slow. Recording a trace while clicking a slow button surfaces the exact “long tasks” (any task blocking the main thread for more than 50ms) responsible for the delay, down to the function call. It’s free, built into every Chromium browser, and should be the first stop for any developer chasing an INP regression.
INP Thresholds and How It’s Scored
Rating | INP (p75) | What it means |
|---|---|---|
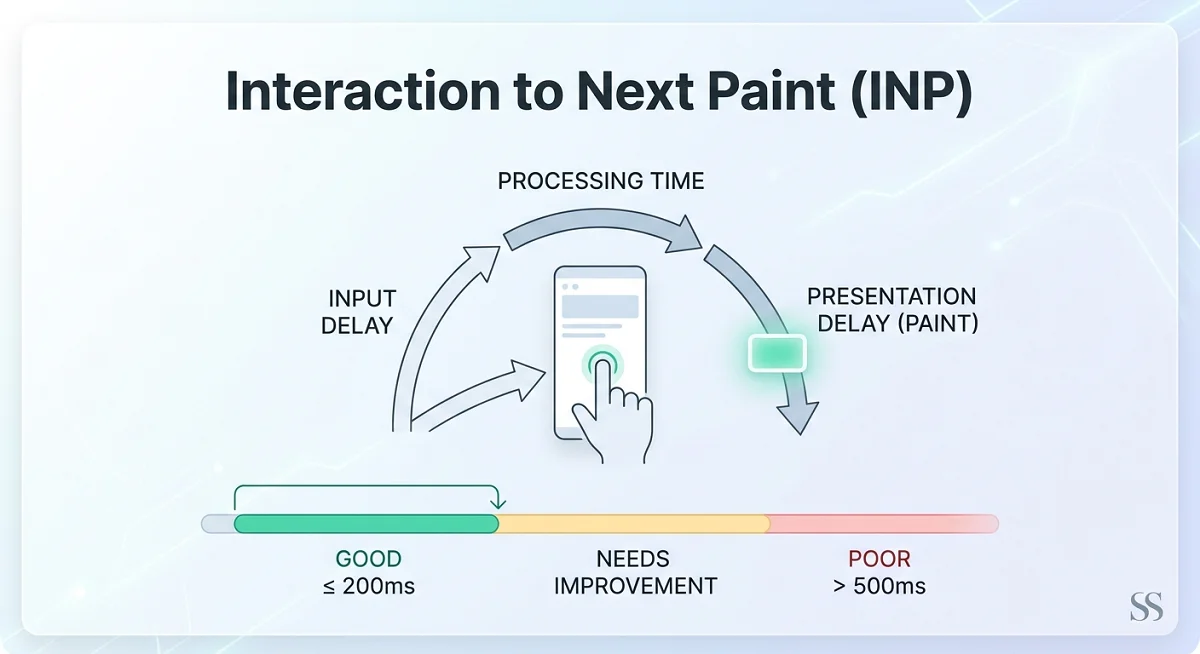
Good | ≤ 200ms | The page feels instantly responsive to almost all users |
Needs Improvement | 200ms – 500ms | Interactions have a noticeable, if tolerable, lag |
Poor | > 500ms | Users perceive the page as broken or frozen |
INP is calculated at the 75th percentile of a page’s interactions across real Chrome users over a rolling 28-day window. That means a page can look fast “on average” and still fail INP if a meaningful slice of real visits (often triggered by mid-range Android devices, weak CPUs, or third-party scripts) cross the 200ms line. Every interaction is broken into three sub-phases that engineers can debug independently:
- Input delay: time the main thread is busy with other work before your event handler can even start running
- Processing time: how long your event handler, state updates, and re-renders actually take to execute
- Presentation delay: the gap between finishing that work and the browser painting the next visual frame, often driven by large DOM size or complex style recalculation
How the Web Performs on INP Today
An analysis of over 55,000 sites by Core Web Vitals monitoring service corewebvitals.io found a median (p50) INP of 87ms and a p75 of 109ms across measured sites in Q1 2026, with 94.7% of sites passing the “Good” threshold, but that figure is skewed toward sites already invested enough in performance to run continuous monitoring. Google’s own broader CrUX-based figures paint a tougher picture across the full web: around 36% of desktop origins and 45% of mobile origins still fail to hit “Good” INP, making it the single worst-performing Core Web Vital for most site categories, ahead of LCP and CLS failure rates.
The same monitoring data shows exactly what drags INP down at scale: pages with heavy iframe usage saw INP climb toward 116ms+ at the 98th percentile of iframe count; pages loading many third-party domains saw INP rise similarly past 127ms, and DOM size showed a comparable pattern: sites with 173–405+ DOM nodes involved in an interaction pushed INP up toward 130ms and beyond. The pattern is consistent across every dataset: third-party scripts, iframes, and bloated DOM trees are the three biggest structural predictors of a poor INP score, more so than raw JavaScript bundle size alone.
INP vs. FID: What Actually Changed
Aspect | FID (deprecated) | INP (current) |
|---|---|---|
Interactions measured | Only the first | Every interaction across the visit |
Good threshold | ≤ 100ms | ≤ 200ms |
What it captures | Input delay only | Input delay + processing + presentation delay |
Retired | March 12, 2024 | Still active |
Typical failure cause | Heavy scripts blocking the first click | Heavy scripts blocking any click, especially deep in a session |
The higher 200ms threshold for INP (versus FID’s 100ms) isn’t Google going easier; however, it reflects that INP measures a longer, more complete pipeline (input delay plus processing plus rendering), whereas FID only ever measured the first sliver of that pipeline. Teams migrating from FID to INP monitoring for the first time often discover their real bottleneck sites weren’t the ones with the slowest first click, but the ones with the heaviest ongoing JavaScript execution.
Tools Comparison: Measuring and Debugging INP
Not every tool measures INP the same way, and picking the wrong one is the most common mistake teams make.
Tool | Data type | Cost | Best for |
|---|---|---|---|
Google PageSpeed Insights | Field (CrUX) + Lab (Lighthouse) | Free | Fast, single-URL check combining real INP data with a simulated audit |
Google Search Console | Field (CrUX) | Free | Site-wide INP monitoring by URL group, matching exactly what Google sees for rankings |
Chrome DevTools Performance panel | Lab (live trace) | Free | Pinpointing the exact long task or function causing a slow interaction |
web-vitals JS library | Field (real users) | Free | Sending real INP data from your own visitors into your own analytics stack |
Chrome UX Report (CrUX) / BigQuery | Field only | Free | Historical, aggregate INP trends across your whole origin or competitors |
WebPageTest | Lab (advanced) | Free | Deep interaction traces and comparing before/after fixes on identical conditions |
DebugBear | Lab + RUM | Paid | Continuous production INP monitoring with alerts when a deploy causes a regression |
Lighthouse is worth calling out separately: in recent versions, it no longer includes a lab-simulated INP score because INP requires a real interaction to measure, and Lighthouse’s automated runs don’t reliably simulate meaningful user input. This is a common source of confusion: teams see a perfect Lighthouse score and assume INP is fine, then find CrUX data in Search Console telling a completely different story. PageSpeed Insights solves this by pairing Lighthouse’s diagnostics with the real CrUX INP figure for the same URL, so it remains the fastest way to sanity-check both at once.
For teams that need to catch INP regressions the moment they ship, rather than waiting up to 28 days for Search Console’s CrUX data to catch up. DebugBear runs scheduled interaction traces in a lab environment alongside real-user monitoring, and can alert engineering teams within minutes of a deploy that pushes INP over the threshold. That immediacy matters most for e-commerce and SaaS teams that deploy multiple times a day, where a single bad release can silently degrade responsiveness for weeks before it shows up in Google’s aggregated field data.
How to Fix a Poor INP Score
INP problems trace back to one root cause in the overwhelming majority of cases: long JavaScript tasks blocking the browser’s main thread when a user tries to interact with the page. If the browser is busy executing a 300ms script when someone clicks “Add to Cart,” it physically cannot paint the response until that script finishes.
- Break up long tasks. Use
scheduler.yield(),setTimeout(), orrequestIdleCallback()to split any task over 50ms into smaller chunks, letting the browser breathe between them and handle interactions in the gaps. - Audit third-party scripts. Chat widgets, analytics tags, ad scripts, and A/B testing tools are consistently among the largest contributors to poor INP because they run code you don’t control on your critical path. Defer or lazy-load anything non-essential to the interaction itself.
- Reduce DOM size. Browsers take measurably longer to process events and recalculate styles on pages with 1,500+ DOM nodes; virtualizing long lists and simplifying markup pays off directly in presentation delay.
- Move heavy computation off the main thread. Web Workers let CPU-intensive logic (sorting, filtering, parsing) run in parallel without blocking the UI thread that needs to respond to clicks.
- Prevent unnecessary re-renders. In React and similar frameworks,
memo,useMemo, anduseCallbackstop components from re-rendering (and re-painting) more than the interaction actually requires. - Code-split aggressively. Ship only the JavaScript a given page needs on first load, deferring anything tied to features the user hasn’t reached yet.
For WordPress and WooCommerce sites specifically, performance plugins like FlyingPress and WP Rocket now include dedicated JavaScript delay and execution-optimization features aimed squarely at INP, deferring non-critical scripts until a user actually interacts with the page rather than loading everything upfront. They won’t fix custom application code, but for sites built on page builders and third-party plugins, they routinely close a large share of the INP gap without touching a line of code.
Frequently Asked Questions
Is INP harder to pass than LCP or CLS?
Generally, yes. Across most large-scale datasets, INP has the lowest pass rate of the three Core Web Vitals, particularly on mobile, where slower CPUs amplify the cost of every JavaScript task. Sites can often fix LCP with image optimization and a CDN, and CLS by reserving layout space; both are largely front-loading problems. INP, by contrast, requires auditing ongoing script execution throughout the session, which tends to involve more code changes and cross-team coordination between engineering and any third-party vendors running scripts on the page.
Does INP replace all responsiveness testing, or just FID?
INP specifically replaced FID as the Core Web Vital used for search ranking and the Chrome UX Report. It doesn’t replace lower-level metrics engineers still use for debugging, like Total Blocking Time (TBT) in lab tools, which estimates how much time is blocked between First Contentful Paint and Time to Interactive. TBT and INP are correlated but not identical: TBT is a lab-only proxy calculated without real user input, while INP requires and reflects an actual interaction.
Can a single slow interaction ruin my entire INP score?
Not a single one in isolation, but a pattern of them will. INP is measured at the 75th percentile of interactions across a real visit, so on a page with only a handful of interactions, one particularly slow click (say, opening a heavy modal) can dominate the reported score. On pages with many interactions, an outlier is more likely to be averaged out, but any interaction consistently triggering a long task across many users will surface clearly at p75.
How quickly will an INP fix show up in Google Search Console?
Not immediately. Google Search Console’s Core Web Vitals report is built on CrUX field data aggregated over a rolling 28-day window, so an INP fix shipped today typically takes anywhere from a few days to a full month to be fully reflected in your reported scores. Use Chrome DevTools or a lab tool to confirm the fix worked immediately after deploying, then treat Search Console as a lagging confirmation rather than a same-day verification tool.
Do third-party scripts really matter that much for INP?
Yes, data consistently shows third-party domains and iframes among the strongest predictors of poor INP at scale, often more impactful than a site’s own first-party code. Every additional ad network, chat widget, or analytics tag adds JavaScript competing for the same main thread your users are trying to interact with. Auditing and trimming third-party tags is frequently the single highest-leverage INP fix available, especially on publisher and e-commerce sites that accumulate vendor scripts over time.
Summary: Fixing INP in Practice
INP is now the Core Web Vital most likely to be dragging a site’s overall Core Web Vitals status down, and it demands a different kind of fix than LCP or CLS, one rooted in ongoing JavaScript execution rather than initial page load. The practical path forward:
- Check your current INP in Google Search Console (site-wide field data) and PageSpeed Insights (per-URL field + lab data)
- Use Chrome DevTools’ Performance panel to record a trace on your slowest-feeling interaction and identify the exact long task
- Audit third-party scripts and iframes first; they’re the highest-leverage fix for most sites
- Break up remaining long tasks with
scheduler.yield()or Web Workers, and memoize unnecessary re-renders - Set up continuous monitoring (a paid RUM tool like DebugBear), so regressions are caught within minutes of a deploy, not within Google’s 28-day field-data lag
Sites that treat INP as an ongoing engineering discipline, not a one-time audit, are the ones consistently showing up in the roughly half of the web that passes all three Core Web Vitals today.

Article By
Shahab Ud Din
I am WordPress Speed and Core Web Vitals Expert. I have optimized 150+ WordPress sites over 5+ years, fixing slow load times, failing Core Web Vitals, and poor mobile scores. Best result: mobile LCP from 30.7s → 2.4s in 3 days. I work with business owners, bloggers, and WooCommerce stores who need fast, rank-ready websites, with a No Fix = No Fee guarantee.