Core Web Vitals: The Complete Guide to Google’s Performance Metrics in 2026
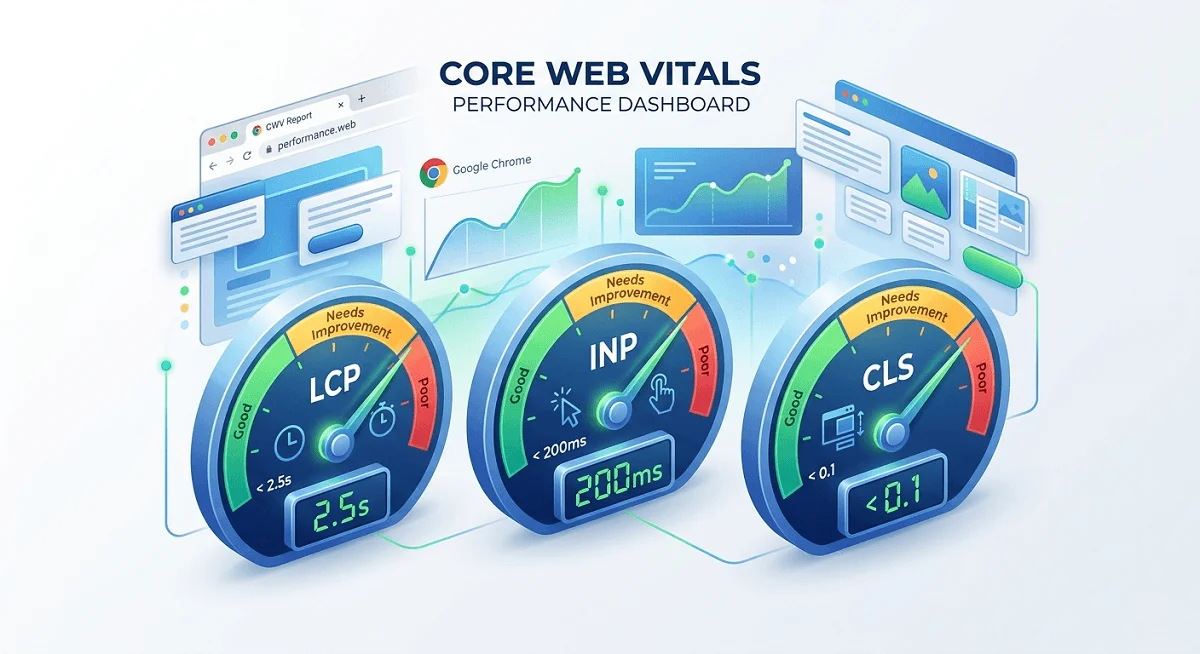
Core Web Vitals are three real-user performance metrics: LCP (<2.5s), INP (<200ms), and CLS (<0.1) that Google uses as ranking signals. Sites that meet all three thresholds rank better, convert more users, and generate measurably more revenue. Fewer than half of all websites pass all three metrics on mobile.
What Are Core Web Vitals?
Core Web Vitals (CWV) are a set of standardized, user-centric metrics introduced by Google in May 2020 to measure real-world page experience: how fast content loads, how quickly a page responds to interaction, and how visually stable it is during load. Unlike traditional speed metrics measured under controlled laboratory conditions, Core Web Vitals rely on field data: performance observations collected from actual Chrome users visiting your site in real-world conditions.
They became an official Google ranking factor in August 2021 as part of the Page Experience Update. Since then, they have evolved significantly. The most notable change came in March 2024, when Google replaced First Input Delay (FID) with Interaction to Next Paint (INP): a more comprehensive responsiveness metric that captures all interactions throughout a session, not just the first one. In 2025, Google is also trialing a new metric called Engagement Reliability (ER), which measures whether interactive elements like buttons and forms function consistently across all devices.
The importance of Core Web Vitals extends well beyond SEO. They are a diagnostic lens into user experience. A site that fails these metrics is almost certainly frustrating real visitors, leading to higher bounce rates, abandoned carts, and lost revenue. Conversely, brands that invest in passing all three metrics consistently report meaningful gains in traffic, engagement, and conversions.
Measuring with Google Search Console: Google Search Console’s Core Web Vitals report shows field data from the Chrome User Experience Report (CrUX), grouped by page type, giving you a site-wide view of which URL groups are “Good,” “Needs Improvement,” or “Poor.” It’s the most direct window into how your site looks to Google’s ranking systems. Access it at Search Console → Experience → Core Web Vitals.
The 3 Core Web Vitals Metrics Explained
LCP
Largest Contentful Paint
< 2.5s
Measures how long it takes for the largest visible content element, typically a hero image, heading, or video, to render in the viewport. Reflects perceived load speed.
INP
Interaction to Next Paint
< 200ms
Measures the latency of all user interactions (clicks, taps, keyboard input) throughout the entire page session. Replaced First Input Delay in March 2024.
CLS
Cumulative Layout Shift
< 0.1
Measures unexpected layout movement of visible elements. A button that jumps when an ad loads above it, or text that shifts as fonts render, all count toward your CLS score.
Why INP Replaced FID (and Why It Matters)
First Input Delay only measures the delay of a page’s very first interaction. This left a critical blind spot: a page could have a good FID score but still feel sluggish after the first click because of unresponsive JavaScript-heavy components. INP corrects this by sampling all interactions during a session and reporting the worst-case latency. For complex, JavaScript-heavy applications, e-commerce product pages, dashboards, and single-page apps, this change is significant. Many sites that passed FID are now discovering INP issues they never knew existed.
The CLS metric, meanwhile, has become increasingly important as web layouts grow more dynamic. Ads, cookie banners, lazy-loaded images, and web fonts are the most common culprits. A CLS score of 0.0 means your layout is perfectly stable; anything above 0.25 is considered poor by Google’s standards, and users will notice it.
Google PageSpeed Insights (pagespeed.web.dev) is the fastest way to check all three Core Web Vitals for any URL. It combines real field data from CrUX with a Lighthouse lab audit, giving you both ranking-relevant data and actionable diagnostics in a single report. Free to use, no login required.
2025 Benchmarks and Thresholds
Google evaluates Core Web Vitals at the 75th percentile of page loads, meaning 75% of real user visits to a URL must meet the threshold for that URL to be classified as “Good.” This is a meaningful bar; a site could perform well on average but still fail if one quarter of its users have a poor experience.
|
Metric |
Good |
Needs Improvement |
Poor |
What It Measures |
|---|---|---|---|---|
|
LCP |
≤ 2.5s |
2.5s – 4.0s |
> 4.0s |
Loading performance |
|
INP |
≤ 200ms |
200ms – 500ms |
> 500ms |
Responsiveness |
|
CLS |
≤ 0.1 |
0.1 – 0.25 |
> 0.25 |
Visual stability |
Pass Rate: How Does the Web Perform Today?
An original study of 208,085 websites found that only 53.77% of sites achieved a “Good” LCP score, and 65.13% achieved good CLS scores, but when all three metrics are evaluated together, fewer than half of all origins pass on mobile. INP has emerged as the hardest metric to crack, particularly for JavaScript-heavy sites. This performance gap represents a genuine competitive opportunity: outperform your peers on Core Web Vitals, and you occupy a technical advantage that compounds over time with Google’s ranking systems.
Sites passing LCP (good)~54%
Sites passing CLS (good)~65%
Sites passing all 3 metrics on mobile<50%
Source: IncRev study of 208,085 websites; 2025 industry benchmarks
Core Web Vitals and SEO: How They Affect Rankings
Google confirmed Core Web Vitals as a ranking signal in August 2021, and since then, they have been progressively integrated more deeply into its core ranking systems, not as a standalone bolt-on signal, but woven into the Page Experience framework alongside mobile-friendliness, HTTPS, and safe browsing.
The practical implication: when two pages are close in content quality and authority, Core Web Vitals can be the tiebreaker that determines which ranks higher.
One industry analysis found that “slow” domains (failing Core Web Vitals) ranked an average of 3.7 percentage points lower in search visibility than “fast” domains. Mobile performance now carries extra weight: Google’s mobile-first indexing means your mobile CWV scores are what Google primarily evaluates, even for desktop search results. With over 60–75% of global web traffic coming from mobile devices, this focus is well-justified, and it puts WordPress sites, which typically lag behind Shopify and Wix on mobile CWV, at a structural disadvantage.
It’s important to maintain perspective, though. Core Web Vitals are a tiebreaker in competitive SERPs, not a trump card. A site with strong topical authority, quality backlinks, and excellent content will still outrank a technically fast but thin site. The real risk is neglect: a site that consistently fails Core Web Vitals signals to Google that it delivers a poor user experience, compounding ranking disadvantages over time. Technical SEO problems like duplicate pages and canonical errors can also impact search visibility.
Ahrefs and other enterprise SEO platforms now surface Core Web Vitals data alongside keyword rankings, backlink metrics, and content scores. Monitoring CWV trends in a unified dashboard helps SEO teams connect technical performance changes directly to organic visibility outcomes, closing the feedback loop between engineering and search performance.
Business Impact: Original Data and Case Studies
53%
of mobile users abandon a website if it takes more than 3 seconds to load. And a 1-second mobile delay can cut conversion rates by up to 20%. Performance is not a technical nice-to-have; it is a direct revenue lever.
The evidence connecting Core Web Vitals to business outcomes is substantial and growing. Google’s own data shows that sites meeting all recommended Core Web Vitals thresholds see a 24% lower abandonment rate compared to those that don’t. For e-commerce, improving load times by just 0.1 seconds has been shown to boost conversion rates by 8% for retail sites and 10% for travel sites.
Real-World Case Studies
Vodafone (Italy)
+8% sales
Improved LCP by 31% through server-side rendering and image optimization. Direct uplift in online sales attributed to the performance change.
Swappie
+42% mobile revenue
Achieved a 55% LCP improvement and 91% CLS improvement. Mobile revenue grew 42% following the optimization initiative.
Ray-Ban
+101% mobile CVR
Implemented Speculation Rules API and bfcache compatibility. Mobile conversion rates on product pages surged by over 100%.
Rakuten
+33% conversion
Optimized Core Web Vitals across their commerce platform and reported 33% higher conversion rates and 53% more revenue per visitor.
redBus
+7% sales
Measured and optimized INP on their bus ticketing platform, resulting in 7% more sales, and 80–100% mobile conversion rate improvement on select properties.
Tencent Video
+70% CTR
By passing all three Core Web Vitals metrics, saw a 70% better click-through rate for video content across their platform.
Product pages are particularly sensitive to LCP performance. Research shows pages can see 40–50% lower conversion rates when users experience a 4–5 second LCP compared to a 2-second LCP. This delta represents millions of dollars in annual revenue for high-traffic e-commerce sites. The business case for Core Web Vitals optimization is now well past theoretical; it has a clear ROI formula.
FlyingPress is one of the most widely used all-in-one performance optimization plugins, designed specifically to improve Core Web Vitals at scale. It handles image compression, caching, code minification, and critical CSS injection, making it particularly useful for WordPress and WooCommerce stores that need CWV improvements without deep developer involvement.
Tools Comparison: How to Measure Core Web Vitals
There is a critical distinction every site owner must understand: field data (from real users) is what Google uses for rankings. Lab data (from simulated tests) is what most speed tools measure. You need both, but they serve different purposes.
|
Tool |
Data Type |
Cost |
LCP/INP/CLS |
Monitoring |
Best Use Case |
|---|---|---|---|---|---|
|
Google PageSpeed Insights |
Field + Lab |
Free |
✓ All 3 |
Manual only |
Primary ranking check; only free tool showing both CrUX field data and Lighthouse lab data together. Start here. |
|
Google Search Console |
Field (CrUX) |
Free |
✓ All 3 |
✓ Continuous |
Site-wide CWV monitoring, grouped by page type. Directly reflects what Google sees for rankings. Essential for all sites. |
|
Google Lighthouse |
Lab only |
Free |
✓ All 3 |
✓ CI/CD |
Developer debugging and CI/CD pipeline integration. Best for diagnosing issues. Note: lab scores can differ 5–15 points between runs. |
|
WebPageTest |
Lab (advanced) |
Free |
✓ All 3 |
Manual |
Best waterfall charts and connection-level throttling. More accurate than Lighthouse for diagnosing render-blocking issues. Developer-preferred. |
|
GTmetrix |
Lab (+ some RUM) |
Free + Pro |
✓ All 3 |
✓ Pro plans |
Client-friendly reports with visualizations. Pro plan ($14.95/mo) adds monitoring and alerts. Good for agencies managing multiple sites. |
|
Chrome UX Report (CrUX) |
Field only |
Free |
✓ All 3 |
✓ Monthly |
Raw real-user data from Chrome users. Updated monthly over a 28-day rolling window. Requires BigQuery or Looker Studio for visualization. |
|
DebugBear |
Lab + RUM |
Paid |
✓ All 3 |
✓ Continuous |
Enterprise RUM monitoring with historical trends. Excellent for catching performance regressions after deploys. |
The Field Data vs. Lab Data Trap
The most common mistake teams make is optimizing for Lighthouse scores in isolation. A perfect Lighthouse score of 100 does not guarantee passing Core Web Vitals in Google Search Console. Lighthouse runs in a controlled environment (typically simulating a mid-range mobile device on throttled 4G), while CrUX captures the diversity of real user devices, network conditions, and locations. The two can diverge significantly, especially for sites with heavy third-party scripts, ads, or large JavaScript payloads that behave differently in real conditions.
The recommended workflow: use Google Search Console and PageSpeed Insights (which shows CrUX data) as your source of truth for ranking signals. Use Lighthouse and WebPageTest for debugging and diagnosing the root causes of issues. Run 3–5 Lighthouse tests and use the median result; individual runs vary by 5–15 points due to CPU scheduling and network timing differences.
DebugBear bridges the field/lab gap by providing both Real User Monitoring (RUM) and scheduled lab tests in a unified dashboard. For e-commerce sites that deploy frequently, it’s particularly valuable; it can alert you immediately when a deploy degrades Core Web Vitals before it affects your Search Console data (which lags by up to 28 days).
CMS and Platform Performance Comparison
Your choice of CMS or website platform has a significant structural impact on your baseline Core Web Vitals performance. The Core Web Vitals Technology Report tracks real-world CWV pass rates across the most popular platforms. As of mid-2025, the results reveal a striking divide between optimized proprietary platforms and the open-source WordPress ecosystem.
|
Platform |
Mobile CWV (Good %) |
Desktop CWV (Good %) |
Key Strength |
Key Weakness |
|---|---|---|---|---|
|
Shopify |
Leading |
Leading |
Built-in CDN, image optimization, performance-first defaults |
Limited control over third-party app scripts |
|
Wix |
Competitive |
Strong |
Platform-level optimizations; 250%+ improvement since 2022 |
Less flexibility for complex custom performance tuning |
|
Squarespace |
Good |
Strong |
Clean templates, good image handling |
Limited plugin ecosystem for advanced optimization |
|
WordPress |
Lagging |
Lagging |
Maximum flexibility; plugins like WP Rocket, NitroPack help |
Plugin bloat, theme overhead, no performance defaults |
|
Magento / Adobe Commerce |
Mixed |
Mixed |
Enterprise feature depth |
Requires significant developer investment to optimize |
WordPress’s performance struggles are well-documented. The platform’s open plugin architecture and the widespread use of page builders (Elementor, Divi) introduce significant JavaScript and CSS overhead. The WordPress core team acknowledged the gap in 2021 and established a dedicated Performance Team. Progress has been made; improvements in Core Web Vitals performance have been shipped in core WordPress releases, but proprietary platforms with built-in optimization pipelines still hold a structural advantage.
For WordPress sites, the path to passing Core Web Vitals typically involves a combination of: a lightweight theme, a performance plugin (WP Rocket, NitroPack, or Perfmatters), a CDN (Cloudflare, BunnyCDN), image optimization (Imagify, ShortPixel), and careful auditing of plugin overhead.
WP Rocket and FlyingPress are the leading WordPress performance plugins specifically designed to improve Core Web Vitals. WP Rocket offers granular control for developers, while FlyingPress optimization is better suited for site owners without a technical background. Both have free trials and are routinely used in Core Web Vitals remediation campaigns.
How to Optimize Each Core Web Vitals
Improving LCP (Largest Contentful Paint)
Slow server response time, render-blocking resources, and unoptimized images most commonly degrade LCP. The LCP element is almost always the page’s hero image or largest heading; identifying it is the first step. Once identified, the optimization path typically involves ensuring that the element is in the HTML (not injected by JavaScript), preloaded with <link rel="preload">, served in modern formats like WebP or AVIF, and delivered via a fast CDN.
Improving INP (Interaction to Next Paint)
INP problems almost always trace back to long JavaScript tasks blocking the browser’s main thread. When a user clicks a button and JavaScript is executing a heavy computation, the browser cannot render the response, creating perceived unresponsiveness. The fix usually involves breaking up long tasks, deferring non-critical JavaScript, and reducing the amount of code that runs on each interaction.
- Use Chrome DevTools Performance panel to identify long tasks (>50ms) on the main thread
- Break up long tasks using
scheduler.yield()orsetTimeout()to yield to the browser between chunks - Audit and remove or defer heavy third-party scripts (analytics, chat widgets, ad scripts)
- Implement code splitting so that only the necessary JavaScript loads for each page
- Use web workers to move complex computations off the main thread
- Reduce the DOM size; browsers take longer to process events on pages with 1,500+ DOM nodes
Improving CLS (Cumulative Layout Shift)
The most common sources of layout shift are images without dimensions, ads or embeds that inject above existing content, and web fonts that cause text to reflow when they load. Preventing CLS is fundamentally about reserving space for dynamic content before it arrives.
- Always specify
widthandheightattributes on images and video elements - Reserve space for ads, iframes, and embeds using aspect-ratio CSS or fixed dimensions
- Avoid inserting content above existing content (popups, banners) after page load
- Use
font-display: optionalto prevent font-swap-induced layout shifts - Use CSS
transformanimations instead of properties that trigger layout (top, left, width, height) - Pre-allocate space for cookie consent banners and notification bars
Cloudflare offers free and paid CDN, image optimization (via Cloudflare Images), and Workers-based edge computing that directly addresses LCP and TTFB bottlenecks. For sites already on Cloudflare, enabling features like Automatic Platform Optimization (APO) for WordPress and Speed Brain (predictive prefetching) can deliver measurable Core Web Vitals improvements with minimal configuration.
Frequently Asked Questions
Core Web Vitals: Common Questions Answered
Not directly or exclusively. Core Web Vitals are one signal among many in Google’s ranking systems. Content quality, backlinks, relevance, E-E-A-T, and other factors carry more weight in most competitive SERPs. However, CWV acts as a tiebreaker when pages are otherwise similar in quality, and failing CWV metrics signals to Google that your site delivers a poor user experience, which can hurt rankings indirectly. Think of it this way: great CWV won’t save bad content, but poor CWV can drag down great content.
These tools measure different things. Lighthouse uses lab data, a simulated test under controlled conditions (fixed device, fixed network throttling). Google Search Console shows field data from the Chrome User Experience Report (CrUX), real measurements from actual Chrome users visiting your site, across all their varied devices and network conditions. A perfect Lighthouse score does not guarantee passing Core Web Vitals in Search Console. For ranking purposes, CrUX field data is what matters. Use Lighthouse for diagnosing problems; use PageSpeed Insights’ CrUX section and Search Console for understanding your actual ranking signal.
Lab data tools like Lighthouse reflect changes immediately; you can see the impact of a code change as soon as you retest. But the CrUX field data shown in Google Search Console and PageSpeed Insights is aggregated over a 28-day rolling window and updated monthly. This means after you make an optimization, it can take up to a full month before the improvement is fully reflected in your field data scores, and before Google’s ranking systems register the change. Don’t panic if you don’t see Search Console improvements instantly. Monitor lab data for early validation, then wait for the field data to catch up.
Mobile, always. Google uses mobile-first indexing, which means your mobile CWV scores carry the primary weight for search rankings, even for desktop queries. Mobile performance is also harder to achieve (slower CPUs, variable network conditions, smaller memory) and has a greater business impact, since over 60–75% of web traffic comes from mobile devices. The practical approach: fix mobile CWV first, then ensure desktop performance doesn’t regress. Tools like PageSpeed Insights report mobile and desktop scores separately, so you can track both.
Engagement Reliability is a new experimental metric Google began testing in 2025 that measures how consistently interactive elements (buttons, forms, links) function without error across all devices and conditions. It goes beyond INP by tracking whether interactions actually work, not just how quickly they respond. As of early 2026, ER has not been confirmed as an official Core Web Vitals or ranking factor; it remains in a research and evaluation phase. However, the direction is clear: Google is moving toward holistic experience measurement, and sites with unreliable interactivity should treat this as a signal to fix underlying JavaScript errors and interaction failures now.
It depends on the competitive landscape of your target keywords. In low-competition SERPs, failing Core Web Vitals may have minimal impact; your content strength wins. In high-competition queries where multiple pages are similarly authoritative, CWV can absolutely be the differentiator. Beyond rankings, failing CWV metrics almost certainly means real users are experiencing a worse journey on your site: slower loads, unexpected layout shifts, sluggish interactions, which translates to higher bounce rates and lower conversion rates, regardless of how Google ranks you. The business case for CWV optimization holds even in isolation from SEO.
Summary: Core Web Vitals Action Plan
Core Web Vitals have matured from a technical curiosity into a mainstream requirement for competitive websites. The three 2025 metrics, LCP under 2.5 seconds, INP under 200ms, and CLS under 0.1, reflect what real users actually experience on your site, and Google’s ranking systems increasingly reflect that reality.
- Run PageSpeed Insights on your top 5 landing pages and note which metrics are failing
- Check Google Search Console’s Core Web Vitals report for site-wide field data by URL group
- Identify your LCP element and confirm it is in the HTML, preloaded, and image-optimized
- Use Chrome DevTools to find long JavaScript tasks contributing to poor INP
- Add explicit dimensions to all images and reserve space for dynamic content (ads, embeds)
- Set up ongoing monitoring (Search Console + a lab tool like GTmetrix) to catch regressions
- Prioritize mobile optimization; this is what Google’s ranking systems evaluate first
The bottom line: Sites that pass all three Core Web Vitals on mobile gain a measurable advantage, in rankings, in user experience, and in conversion rates. The data from hundreds of case studies is consistent: faster, more stable, more responsive pages convert better and retain users longer. Tools like Google Search Console, PageSpeed Insights, Lighthouse, WebPageTest, and platform-level plugins like FlyingPress or WP Rocket give you everything you need to diagnose and fix CWV issues systematically. Performance is no longer a developer concern; it’s a business imperative.

Article By
Shahab Ud Din
I am WordPress Speed and Core Web Vitals Expert. I have optimized 150+ WordPress sites over 5+ years, fixing slow load times, failing Core Web Vitals, and poor mobile scores. Best result: mobile LCP from 30.7s → 2.4s in 3 days. I work with business owners, bloggers, and WooCommerce stores who need fast, rank-ready websites, with a No Fix = No Fee guarantee.